
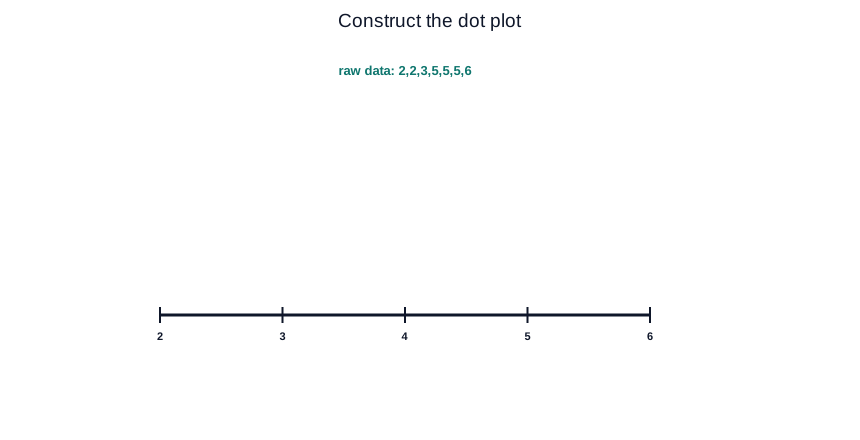
Construct the dot plot for data 2,2,3,5,5,5,6 using axis ticks 2 through 6 by 1. Give the axis ticks, count at each tick, total dots, and maximum stack.
 Open full size