All courses Math II · F-LE.3 26 of 73
Compare growth of exponential, linear, quadratic, and other polynomial models using graphs/tables.

Compare linear and exponential table growth precisely

Problem
Analyze the table for n=0,1,2,3. Compute consecutive differences for L and consecutive ratios for E, record the leader or tie at each listed n, then extend both patterns to n=4 and identify the first overtake after the table.
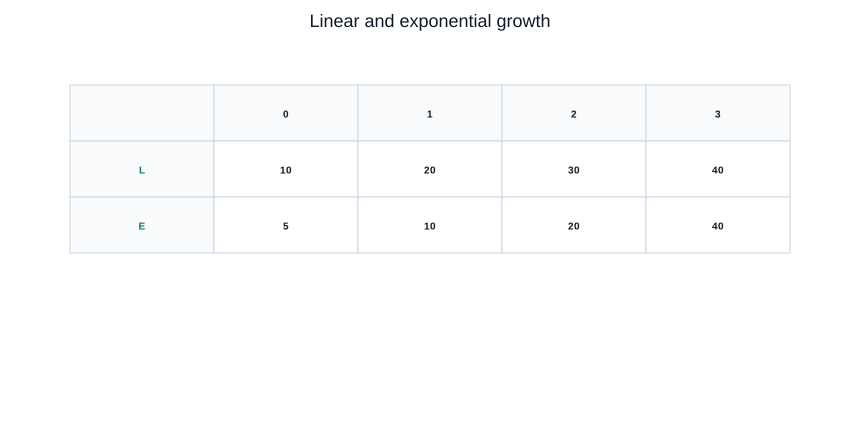
Source table for n=0,1,2,3: L values 10,20,30,40 and E values 5,10,20,40. Open full size
Your answer
Show answer choicesAnswer choices Work through the mathematics first, then compare your reasoning.Select the answer that matches your work.
Answer choices
With a free account

Keep complete walkthroughs close.

Every problem included with your account keeps its hints and full solution walkthrough available for review.

Create a free account
With paid access

Learn from every walkthrough.

Unlock the complete problem bank and its worked solution walkthroughs, not only the walkthroughs in the starter set.

Compare plans

Hint

Compute consecutive differences for L and ratios for E.

Linear tables have a constant difference; exponential tables have a constant nonunit factor.

Solution walkthrough

01

Identify the linear pattern

\[L:~10,~20,~30,~40\]

The linear values increase by \(+10\) each step, which is constant additive growth.

02

Identify the exponential pattern

\[E:~5,~10,~20,~40\]

The exponential values double each step, which is multiplicative growth.

03

Compare their values over the table

\[\text{at}~n~=~3,~\text{both}~\text{are}~40\]

The exponential starts lower, but its doubling pattern lets it catch up to the linear table by \(n=3\).

04

State the comparison

\[L~\text{model}=\text{linear};~L~\text{constant}~\text{difference}=+10;~E~\text{model}=\text{exponential};~E~\text{constant}~\text{factor}=×2;~\text{listed}~\text{leader}~\text{sequence}=L,L,L,\text{tie};~\text{first}~\text{listed}~\text{equality}=n=3;~\text{first}~\text{listed}~\text{overtake}=\text{none};~\text{next}-\text{row}~\text{check}~n=4:L=50,E=80;~\text{first}~\text{overtake}~\text{after}~\text{table}=E~\text{at}~n=4;~\text{eventual}~\text{dominance}=E\]

This compares both the matching value and the reason the exponential catches up.

+

Another way

  1. Compute differences for the linear table and ratios for the exponential table to see the two growth rules side by side.

!

Common mistake

Saying the exponential already exceeds the linear at \(n=3\), even though both tables show \(40\) there.

Answer comparison: L has constant difference +10; E has factor 2. Leaders are L,L,L,tie for n=0–3; at n=4, L=50 and E=80, so E first overtakes after the table.
L model=linear; L constant difference=+10; E model=exponential; E constant factor=×2; listed leader sequence=L,L,L,tie; first listed equality=n=3; first listed overtake=none; next-row check n=4:L=50,E=80; first overtake after table=E at n=4; eventual dominance=E