All courses Math Foundations · MF.DP.2 56 of 60
Read and compare dot plots, histograms, and box plots to describe center, spread, and shape.

Read a dot plot exactly

Problem
This dot plot shows quiz scores.

Score: 5 6 7 8 9 10
Dots: • •• ••• •••• •• •

How many students scored exactly 8?
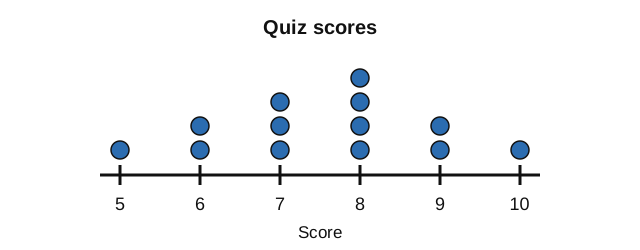
Dot plot of quiz scores on a labeled number line from 5 to 10. There is 1 dot at 5, 2 dots at 6, 3 dots at 7, 4 dots at 8, 2 dots at 9, and 1 dot at 10. Open full size
Your answer
Show answer choicesAnswer choices Work through the mathematics first, then compare your reasoning.Select the answer that matches your work.
Answer choices
With a free account

Stop now. Continue later.

A saved learning session lets you leave when you need to and return without losing your place.

Create a free account
With paid access

Use the screen to choose. Use paper to solve.

Build the exact session you want online, then export it as a printable worksheet.

Compare plans

Hint

Find the label 8 on the score line, then look only at the dots directly above 8.

In a dot plot, each dot stands for 1 student, and “exactly 8” means count only the dots at 8, not at 7 or 9.

Solution walkthrough

01

Locate the requested score

\[\text{score}=8\]

The question asks for the frequency at exactly 8, so use only the stack directly above 8.

02

Interpret the dot plot

\[1~\text{dot}=1~\text{student}\]

Each dot represents one student's quiz score.

03

Count the matching dots

\[\text{dots}~\text{above}~8=4\]

There are four dots in the stack aligned with score 8.

04

Report the frequency

\[4~\text{students}\]

Four students scored exactly 8.

+

Another way

  1. Read the text form of the dot plot: the four bullet symbols in the 8 column give the same frequency.

!

Common mistake

Do not count the dots over neighboring scores 7 or 9; the prompt asks for exactly 8.