All courses Math I · S-ID.3 52 of 59
Interpret differences in shape, center, spread, and outliers in context.

Classify the shape of a dot plot

Problem
Classify the dot plot with counts 1:1,2:2,3:4,4:2,5:1. Report its modality, symmetry or skew, gaps, visual outliers, and supporting frequency evidence.
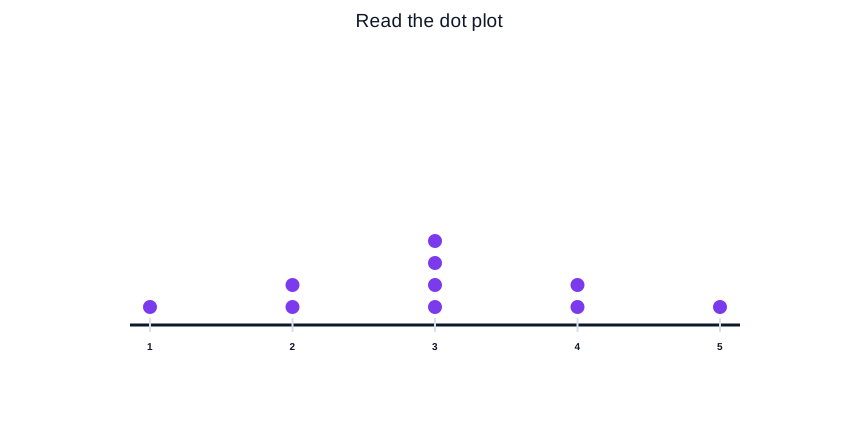
Source statistical display: Which complete classification correctly describes a dot plot with counts {1:1,2:2,3:4,4:2,5:1}? No requested comparison or classification is annotated. Open full size
Your answer
Show answer choicesAnswer choices Work through the mathematics first, then compare your reasoning.Select the answer that matches your work.
Answer choices
With a free account

See progress instead of guessing.

Gozunta keeps your results together so you can see what you have practiced and how it went.

Create a free account
With paid access

Keep going when the starter set ends.

A subscription removes the locked gaps from your selected course so practice can continue through the full sequence.

Compare plans

Hint

Locate maximum counts, compare equal-distance pairs around a center, then scan zero-frequency ticks and test any isolated extreme.

A distribution can have several simultaneous shape properties: modality, symmetry/skew, uniformity, gaps, and outliers. Report them in separate fields.

Solution walkthrough

01

Locate the modal value

\[\text{counts}~1,2,4,2,1~\text{have}~\text{unique}~\text{maximum}~4~\text{at}~\text{value}~3\]

One unique tallest stack makes the distribution unimodal with mode 3.

02

Test symmetry around 3

\[\text{count}~\text{at}~1=\text{count}~\text{at}~5=1;~\text{count}~\text{at}~2=\text{count}~\text{at}~4=2\]

Values equally far from 3 have equal frequencies, forming a balanced mound around the center.

03

Check for gaps

\[\text{every}~\text{integer}~\text{from}~1~\text{through}~5~\text{has}~\text{positive}~\text{frequency}\]

No interior tick has zero dots, so there is no gap from 1 to 5.

04

Check visual outliers

\[\text{the}~\text{outer}~\text{values}~1~\text{and}~5~\text{are}~\text{equally}~\text{spaced}~\text{from}~\text{the}~\text{center}~\text{and}~\text{part}~\text{of}~\text{the}~\text{symmetric}~\text{taper}\]

Neither endpoint is isolated from the rest of the distribution.

05

Report the full shape classification

\[\text{modality}=\text{unimodal}~\text{with}~\text{mode}3;~\text{symmetry}=\text{symmetric}/\text{mound}-\text{shaped}~\text{about}3;~\text{gaps}=\text{none}~\text{from}1–5;~\text{visual}~\text{outliers}=\text{none};~\text{evidence}=\text{counts}~\text{pair}~1↔5~\text{as}1,~2↔4~\text{as}2,~\text{with}~\text{peak}4~\text{at}3\]

This separately states modality, symmetry, gaps, outliers, and the exact frequency evidence.

+

Another way

  1. Fold the frequency sequence 1,2,4,2,1 across its center; the left and right entries pair exactly.

!

Common mistake

Do not label 5 an outlier merely because it is an endpoint. It mirrors value 1 and continues the symmetric frequency pattern.

Worked statistical record: modality=unimodal with mode3; symmetry=symmetric/mound-shaped about3; gaps=none from1–5; visual outliers=none; evidence=counts pair 1↔5 as1, 2↔4 as2, with peak4 at3
modality=unimodal with mode3; symmetry=symmetric/mound-shaped about3; gaps=none from1–5; visual outliers=none; evidence=counts pair 1↔5 as1, 2↔4 as2, with peak4 at3