All courses Algebra II · F-IF.7.e 33 of 55
Graph exponential, logarithmic, and trigonometric functions with key features.

Graph exponential growth from complete feature fields

Problem
Analyze \(f(x)~=~3~\cdot~2^x\). State \(a,~b,~h,~\text{and}~k\); classify growth or decay; give the intercepts, asymptote, domain, range, and monotonic behavior; and compute exact anchors at \(x~=~-1\), \(0\), and \(1\).
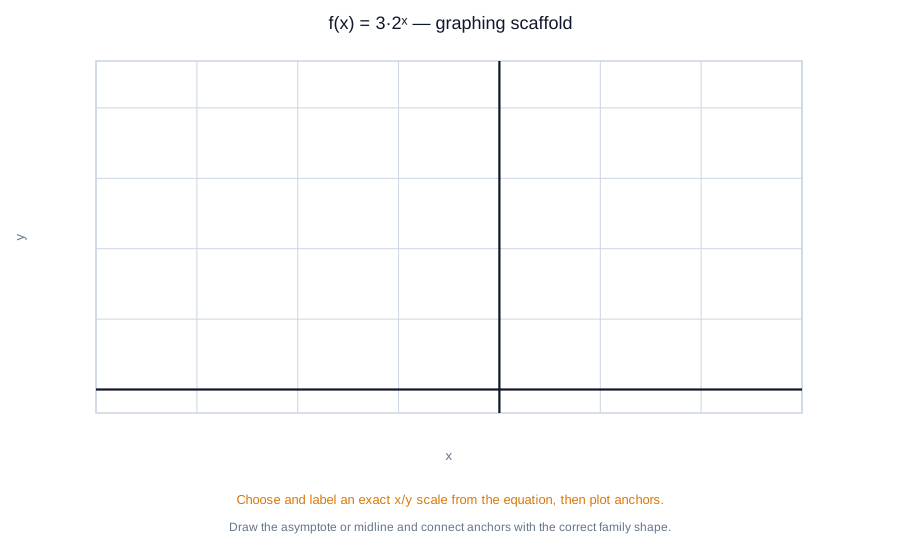
Prompt coordinate grid scaled for the stated exponential equation; the curve, anchors, and asymptote are withheld. Open full size
Your answer
Show answer choicesHide answer choices Work through the mathematics first, then compare your reasoning.Select the answer that matches your work.
Answer choices
With a free account

Share practice with a session code.

Every learning session has a code, making it easy to share the same included practice with someone else.

Create a free account
With paid access

Use the screen to choose. Use paper to solve.

Build the exact session you want online, then export it as a printable worksheet.

Compare plans

Hint

Identify a,b,h,k and evaluate f(0) separately from the shifted anchor.

For a·bˣ⁻h+k with a>0,b>1: asymptote y=k, range (k,∞), and parent anchor (0,1) maps to (h,a+k).

Solution walkthrough

01

Match the exponential form

\[f(x)=a*b^{x-h}+k=3*2^{x-0}+0\]

Comparing the given function with the transformed exponential form gives a=3, b=2, h=0, and k=0. The coefficient 3 is a vertical scale, not a horizontal shift.

02

Classify and find the main features

\[b=2>1~->~\text{growth};~f(0)=3*2^0=3;~y=k=0\]

A base greater than 1 produces growth. Evaluating at x=0 gives the y-intercept (0,3), while the outside shift k gives the horizontal asymptote y=0. Positive exponential outputs make the range y>0; the domain is all real numbers, and the function is increasing.

03

Compute exact anchors

\[f(-1)=3*2^{-1}=3/2;~f(0)=3;~f(1)=3*2=6\]

Substitute each requested x-value into the original function. These points also check the growth factor: each step right doubles the output.

04

State the complete analysis

\[\text{Parameters}:~a~=~3,~b~=~2,~h~=~0,~k~=~0.~\text{Class}:~\text{growth}~\text{because}~b~>~1.~\text{Features}:~y-\text{intercept}~(0,~3);~\text{asymptote}~y~=~0;~\text{domain}~\text{all}~\text{real}~\text{numbers};~\text{range}~y~>~0;~\text{increasing}.~\text{Anchors}:~(-1,~3/2),~(0,~3),~(1,~6).\]

All requested parameters, graph features, and exact anchors agree with the function, so this is choice A.

+

Another way

  1. Start from the parent anchors (-1,1/2), (0,1), and (1,2), then multiply every y-coordinate by 3.

!

Common mistake

Do not call x=0 a vertical asymptote or use 3 as a shift. For a*bˣ⁻h+k, the asymptote is the horizontal line y=k, and the y-intercept must be found by evaluating the whole function at x=0.

Answer exponential graph with the exact curve, horizontal asymptote, anchor points, domain, range, and monotonic direction marked.
The completed exponential graph verifies the requested exact features.

Solution walkthrough video