
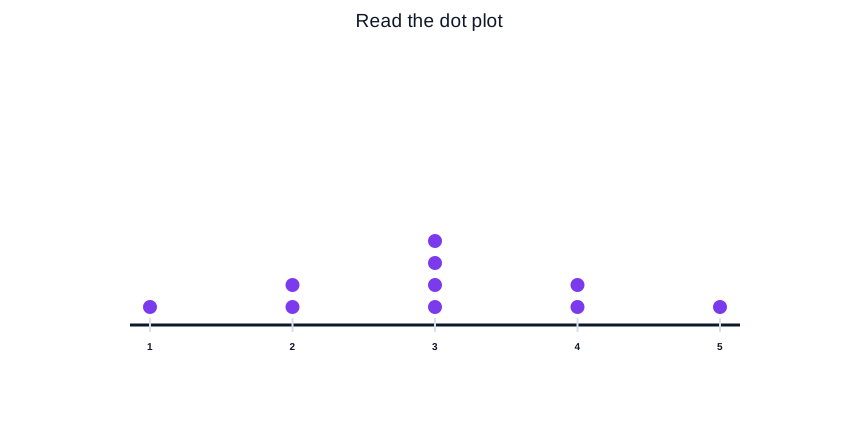
Classify the dot plot with counts \({1:1,2:2,3:4,4:2,5:1}\). Report its modality, symmetry or skew, gaps, visual outliers, and supporting frequency evidence.
 Open full size